
Previous releases of OpenInsight have included a simple logging system that records all stored procedure calls and the time taken to execute them. This logging system is enabled by creating a blank file called “RevProfile.log” in the OpenInsight directory before the application is started. If this file is present when the system boots it creates a new log file (with a name based on the application’s Windows Process ID) and writes all stored procedure activity to it until the application is stopped.
Whilst this can be a useful tool it does suffer from a few issues:
- The log file records all activity. This usually results in very large files that are difficult to navigate and process, making them very tedious to use.
- There is no facility to annotate parts of the log, so it can be difficult to narrow down the actual section of code that needs to be profiled.
- The profile timing uses the classic Windows “tick count” which has a granularity of 16ms. Many stored procedures take much less time to execute than this, so entries in the log can be wildly inaccurate, usually appearing as “0ms” or “16ms”.
- There are no tools to actually parse the log so that it can be analyzed more easily.
With this release of OpenInsight we have provided some new functionality to address these issues, namely:
- The “RevProfileLog” function, and
- The “RevProfile Log Analyzer” form.
In this post we’ll take a look at these additions and examine how they can help in your application development.
The RevProfileLog function
This is a new stored procedure for version 10.2 that allows much greater control of the profile logging process and offers the following benefits:
- It can be started and stopped as needed, allowing the scope of recording to be narrowed to a critical area (we call this “Dynamic Logging“, as opposed to the old way of profile logging mentioned above, which we call “Static Logging“).
- The log file can be created using a custom name and location.
- The file can be appended to each time it is started, or cleared.
- The log can exclude specific stored procedures.
- The log can record notes against a specific stored procedure to help identify a particular call in the log.
- The log can record arbitrary text in the file to help with subsequent analysis.
All of this is controlled via the new RevProfileLog stored procedure (this is compiled as a subroutine so has no return value):
Call RevProfileLog( Method, Param1, Param2 )
The Method parameter is a numeric value that specifies the logging operation to perform; the Param1 and Param2 parameters depend on Method as described below:
| Method | Description | Param1 | Param2 |
|---|---|---|---|
| 1 | Start Log: Starts the profile logging activity. | The name of the log file to use or create. | A boolean flag – if TRUE$ then the log file is cleared before use. Defaults to FALSE$. |
| 2 | Stop Log: Stops the profile logging activity. | N/a. | N/a. |
| 3 | Set Note: Appends text to the next stored procedure call written to the log. It is reset to null afterwards. | The note text. | N/a. |
| 4 | Output Text: Outputs text to the log. | The text to output. | The indent to output to. Specify “-1” (the default) to output at the current indent, otherwise specify a value between 1 and 256 if desired. |
| 5 | Exclude Proc: Prevents a stored procedure from being included in the log file. | The name of the stored procedure (upper- case). | N/a. |
| 6 | Include Proc: Removes a stored procedure from the list of excluded stored procedures so that it may be written to the log again. | The name of the stored procedure (upper-case). | N/a. |
| 7 | Clear Excluded: Clears the excluded stored procedure list. | N/a. | N/a. |
Equates for these methods can be found in the RTI_REVPROFILE_EQUATES insert record.
Example: Profiling a call to Get_Property
Compile Subroutine Test_RevProfileLog( void )

   Declare Function Get_Property
   $Insert RTI_RevProfileLog_Equates
   $Insert Logical

   LogFile = "c:\temp\test_revprofile.log"

   // Create the log file and clear it before it is written to:
   Call RevProfileLog( RPL_STARTLOG$, logFile, TRUE$ )

   // Let's not see any RTP57/A calls (if any)
   Call RevProfileLog( RPL_EXCLUDEPROC$, "RTP57" )
   Call RevProfileLog( RPL_EXCLUDEPROC$, "RTP57A" )

   // Add a note so we can see why we are calling Get_Property
   Call RevProfileLog( RPL_SETNOTE$, "Getting SYSTEM VERSION" )
   Version = Get_Property( "SYSTEM", "VERSION" )

   // Add some text to the log, but don't indent it.
   Call RevProfileLog( RPL_OUTPUTTEXT$, "Done with this log now ***", 0 )

   // Stop the log
   Call RevProfileLog( RPL_STOPLOG$ )

Return
Produces the following log file:
		GET_PROPERTY 0.00 Getting SYSTEM VERSION
			PS_GET_PROPERTY 0.12
				OEREQINFO 0.15
				OEREQINFO 2.29 2.14
			PS_GET_PROPERTY 2.31 2.19
			PS_GET_PROPERTY 2.32
				OEREQINFO 2.32
				OEREQINFO 2.42 0.10
			PS_GET_PROPERTY 2.43 0.12
			PS_GET_PROPERTY 2.44
				OEREQINFO 2.44
				OEREQINFO 2.53 0.09
			PS_GET_PROPERTY 2.55 0.11
			PS_GET_PROPERTY 2.55
				OEREQINFO 2.56
				OEREQINFO 2.65 0.09
			PS_GET_PROPERTY 2.66 0.11
			RTP65 2.67
			RTP65 2.67 0.01
			PS_GET_PROPERTY 2.68
				OEREQINFO 2.69
				OEREQINFO 2.78 0.09
			PS_GET_PROPERTY 2.79 0.11
		GET_PROPERTY 2.80 2.80
>> Done with this log now ***
Things to note:
- Text lines added with the “Output Text” method are prefixed with a “>>” string to denote that they are text.
- The timings now use the Windows high resolution “QueryPerfomanceCounter” functions to record timings, so the results are far more accurate and we’re now reporting at a 100th of a millsecond.
- The indenting does not begin at “level 1” because the system call stack was already several levels in before logging was started.
- Calls to RevProfileLog itself are always excluded.
- As we mentioned above we call the original method of profile logging “static logging” (i.e. create a file called “RevProfile.log” and record everything). This feature still works in the same way, but with the added bonus of using the improved timings and respecting all of the RevProfileLog function methods except for the “Start Log” and “Stop Log” methods. They are ignored during static logging.
The RevProfile Log Analyzer form
This is a new form (called RTI_IDE_ANALYZE_REVPROFILELOG) that can parse a RevProfile log file and present the information in a format that is easy to use.
For example, here is the small log file example shown above processed and loaded into the form:
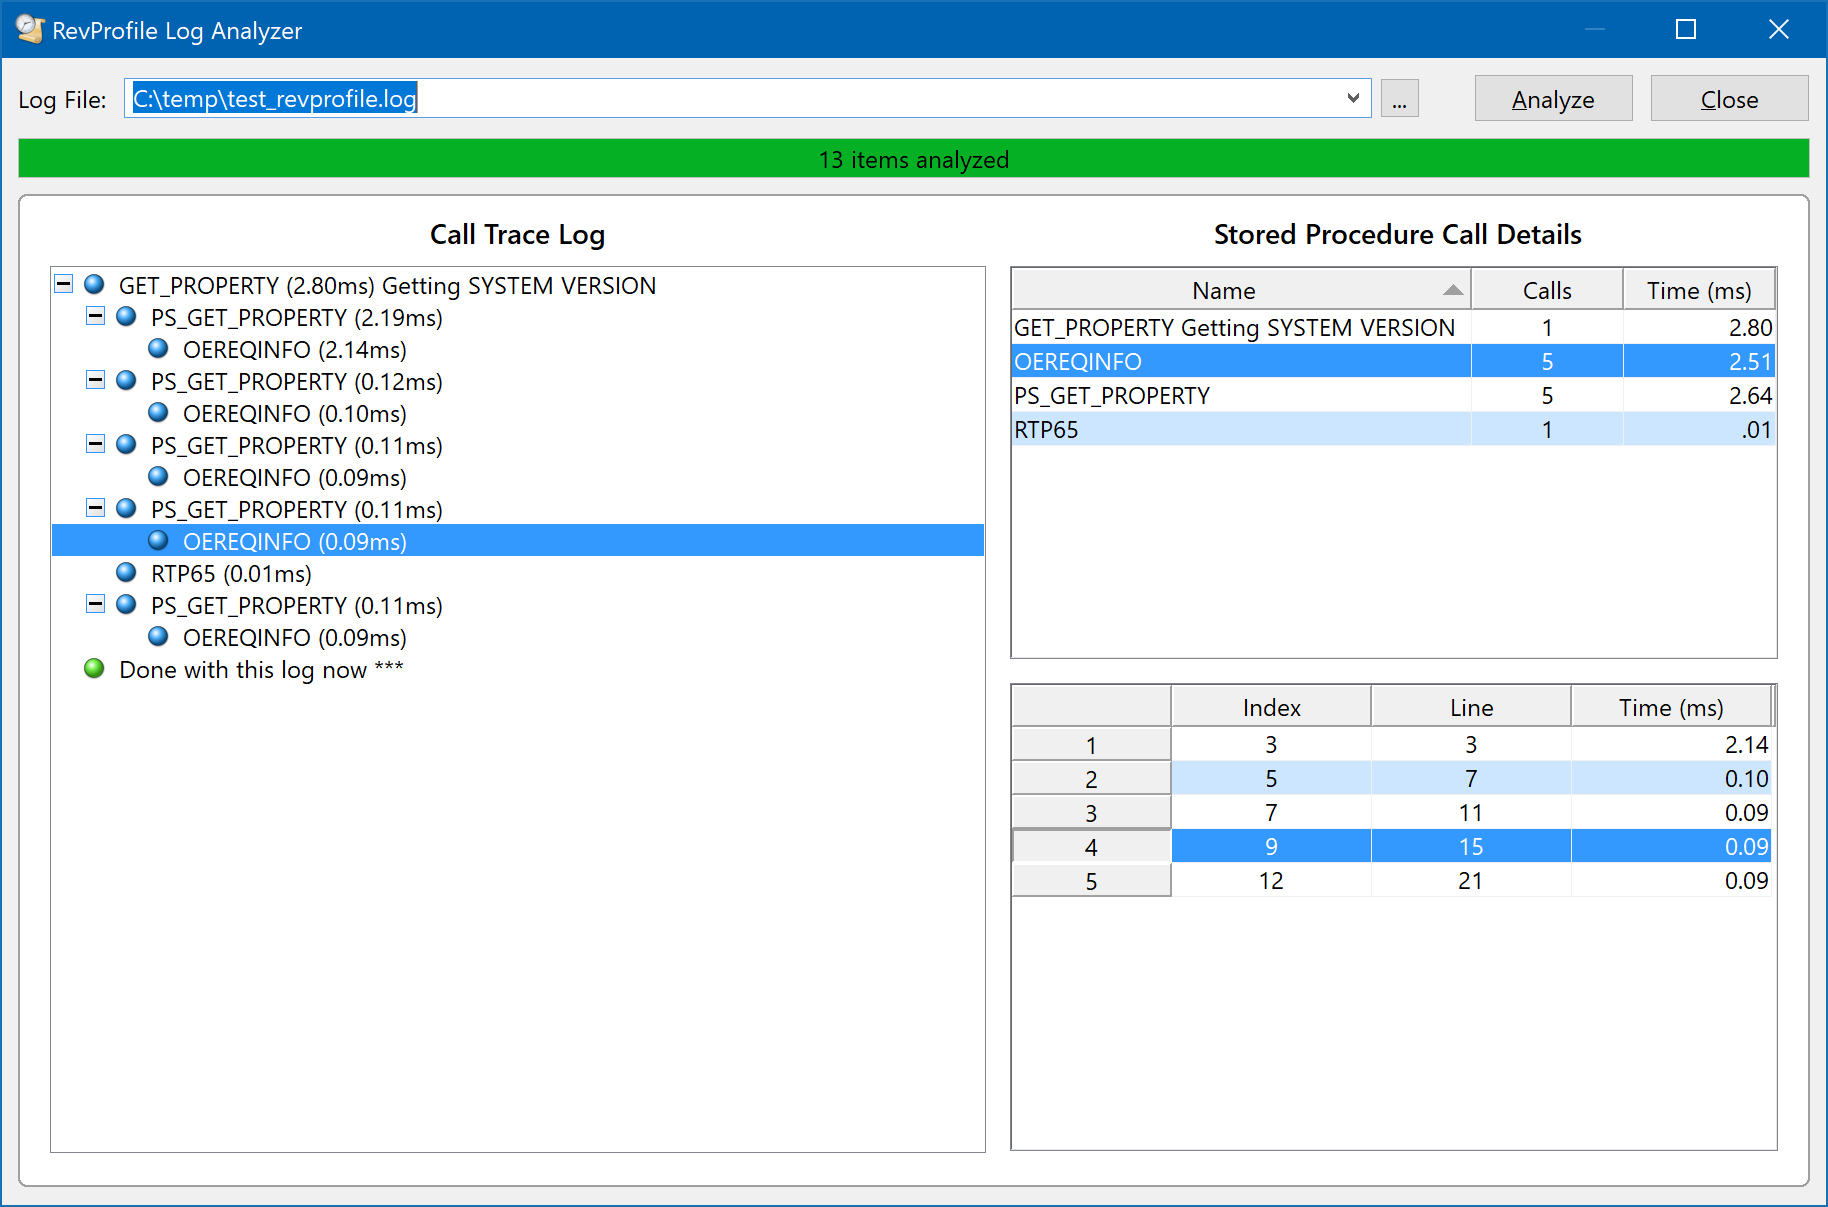
Using this form is fairly simple: just select the log file you want to analyze and wait for the form to parse and process the information. Once this has been done the data from the log is presented in two sections:
- The Call Trace Log (on the left), and
- The Stored Procedure Call Details (on the right)
The Call Trace Log
This is a TreeListBox control that shows the sequence of calls along with the time taken for that call. It mirrors the structure of the actual log file and displays text notes using a different icon (a green globe), rather than the blue one used for stored procedure calls.
Double-clicking on a stored procedure call selects it in the Stored Procedure Call Details section on the right.
The Stored Procedure Call Details
This section comprises two EditTable controls:
- The top one contains a list of all the stored procedures found in the log, along with the number of times each was was executed and the total time spent executing.
- The bottom one details the individual calls to the selected stored procedure – each entry in the table shows the index of the call in the Call Trace Log, the line number in the actual log file where the call was recorded, and the time taken by that call. Double-clicking a call selects the matching entry in the Call Trace Log opposite.
Things to note
- Both edit tables support sorting via double-clicking on the appropriate column header.
- Annotated stored procedure calls (i.e those with a note added to them via the RevProfileLog “Set Note” method) are separated from calls to the same stored procedure that are not annotated. This is to ensure that it is easy to isolate and find them in the output.
Very large log files – a cautionary note
RevProfile log files can grow rather large, especially the “static” log files that record the entire lifetime of the application. Whilst these files can be easily read and parsed in smaller chunks, representing their call trace structure in a something like a TreeListBox control can be challenging due to the time taken to load items. For example, something like a 15MB log file with nearly 200,000 calls may take several seconds to appear in the control once the log has been parsed and we set the control’s LIST property (i.e. “Loading call trace list …” appears in the progress bar), and the UI may appear frozen. This is not the case – if you are loading a very large file be sure to exercise a little patience before you reach for the Task Manager!
Conclusion
The new RevProfileLog function provides much better and much-needed profile logging functionality to OpenInsight, making the information much easier to use, and we’re sure it will help you improve the performance of your applications.
(This functionality is available in OpenInsight 10.2 from the Beta 3 release onwards)
(Edit 26 Jun 24 – Corrected name of analyzer form)


