As you know, dynamic arrays in OpenInsight are internally represented as delimiter-separated strings commonly containing fields, values and sub-values. Traditionally, locating an element required scanning the string from the start to find the required delimiters at the specified index . This can be a performance issue on large arrays, so one of the new features we’ve added to OpenInsight 11 is index/offset caching.
This is a technique that involves caching the byte offsets of previously located field, value and sub-value indexes when you use the “<>” operators, and the Insert/Extract/Replace/Delete functions. This means that we don’t always have to start scanning from the beginning of the string each time an element is accessed.
For example, suppose field 67 is located at byte offset 234, and field 68 begins at offset 245.
Without caching, locating field 68 requires rescanning the dynamic array from the beginning to find all preceding field marks.
With caching, once field 67 has already been located, the search for field 68 can begin from offset 234 instead of offset 1.
This optimization is especially effective when forward-iterating through large dynamic arrays, where successive accesses are close together. In previous versions, repeatedly accessing successive fields could result in near O(n²) scanning behaviour for large arrays. Offset caching eliminates much of this repeated work.
Consider the following program which processes 10000 SYSOBJ keys:
Running this benchmark on the same machine using v10.2.4 took approximately 360ms, while OpenInsight 11 completed the same test in around 1–2ms.
For small dynamic arrays the difference may not be noticeable, but performance improvements become increasingly significant as array sizes grow.
This means you can continue using the familiar “<>” syntax for sequential dynamic array processing without needing to rewrite code using LOOP/REMOVE or LOOP/[] parsing patterns.
Previous releases of OpenInsight have included a simple logging system that records all stored procedure calls and the time taken to execute them. This logging system is enabled by creating a blank file called “RevProfile.log” in the OpenInsight directory before the application is started. If this file is present when the system boots it creates a new log file (with a name based on the application’s Windows Process ID) and writes all stored procedure activity to it until the application is stopped.
Whilst this can be a useful tool it does suffer from a few issues:
The log file records all activity. This usually results in very large files that are difficult to navigate and process, making them very tedious to use.
There is no facility to annotate parts of the log, so it can be difficult to narrow down the actual section of code that needs to be profiled.
The profile timing uses the classic Windows “tick count” which has a granularity of 16ms. Many stored procedures take much less time to execute than this, so entries in the log can be wildly inaccurate, usually appearing as “0ms” or “16ms”.
There are no tools to actually parse the log so that it can be analyzed more easily.
With this release of OpenInsight we have provided some new functionality to address these issues, namely:
The “RevProfileLog” function, and
The “RevProfile Log Analyzer” form.
In this post we’ll take a look at these additions and examine how they can help in your application development.
The RevProfileLog function
This is a new stored procedure for version 10.2 that allows much greater control of the profile logging process and offers the following benefits:
It can be started and stopped as needed, allowing the scope of recording to be narrowed to a critical area (we call this “Dynamic Logging“, as opposed to the old way of profile logging mentioned above, which we call “Static Logging“).
The log file can be created using a custom name and location.
The file can be appended to each time it is started, or cleared.
The log can exclude specific stored procedures.
The log can record notes against a specific stored procedure to help identify a particular call in the log.
The log can record arbitrary text in the file to help with subsequent analysis.
All of this is controlled via the new RevProfileLog stored procedure (this is compiled as a subroutine so has no return value):
Call RevProfileLog( Method, Param1, Param2 )
The Method parameter is a numeric value that specifies the logging operation to perform; the Param1 and Param2 parameters depend on Method as described below:
Method
Description
Param1
Param2
1
Start Log: Starts the profile logging activity.
The name of the log file to use or create.
A boolean flag – if TRUE$ then the log file is cleared before use. Defaults to FALSE$.
2
Stop Log: Stops the profile logging activity.
N/a.
N/a.
3
Set Note: Appends text to the next stored procedure call written to the log. It is reset to null afterwards.
The note text.
N/a.
4
Output Text: Outputs text to the log.
The text to output.
The indent to output to. Specify “-1” (the default) to output at the current indent, otherwise specify a value between 1 and 256 if desired.
5
Exclude Proc: Prevents a stored procedure from being included in the log file.
The name of the stored procedure (upper- case).
N/a.
6
Include Proc: Removes a stored procedure from the list of excluded stored procedures so that it may be written to the log again.
The name of the stored procedure (upper-case).
N/a.
7
Clear Excluded: Clears the excluded stored procedure list.
N/a.
N/a.
Equates for these methods can be found in the RTI_REVPROFILE_EQUATES insert record.
Example: Profiling a call to Get_Property
Compile Subroutine Test_RevProfileLog( void )

   Declare Function Get_Property
   $Insert RTI_RevProfileLog_Equates
   $Insert Logical

   LogFile = "c:\temp\test_revprofile.log"

   // Create the log file and clear it before it is written to:
   Call RevProfileLog( RPL_STARTLOG$, logFile, TRUE$ )

   // Let's not see any RTP57/A calls (if any)
   Call RevProfileLog( RPL_EXCLUDEPROC$, "RTP57" )
   Call RevProfileLog( RPL_EXCLUDEPROC$, "RTP57A" )

   // Add a note so we can see why we are calling Get_Property
   Call RevProfileLog( RPL_SETNOTE$, "Getting SYSTEM VERSION" )
   Version = Get_Property( "SYSTEM", "VERSION" )

   // Add some text to the log, but don't indent it.
   Call RevProfileLog( RPL_OUTPUTTEXT$, "Done with this log now ***", 0 )

   // Stop the log
   Call RevProfileLog( RPL_STOPLOG$ )

Return
Text lines added with the “Output Text” method are prefixed with a “>>” string to denote that they are text.
The timings now use the Windows high resolution “QueryPerfomanceCounter” functions to record timings, so the results are far more accurate and we’re now reporting at a 100th of a millsecond.
The indenting does not begin at “level 1” because the system call stack was already several levels in before logging was started.
Calls to RevProfileLog itself are always excluded.
As we mentioned above we call the original method of profile logging “static logging” (i.e. create a file called “RevProfile.log” and record everything). This feature still works in the same way, but with the added bonus of using the improved timings and respecting all of the RevProfileLog function methods except for the “Start Log” and “Stop Log” methods. They are ignored during static logging.
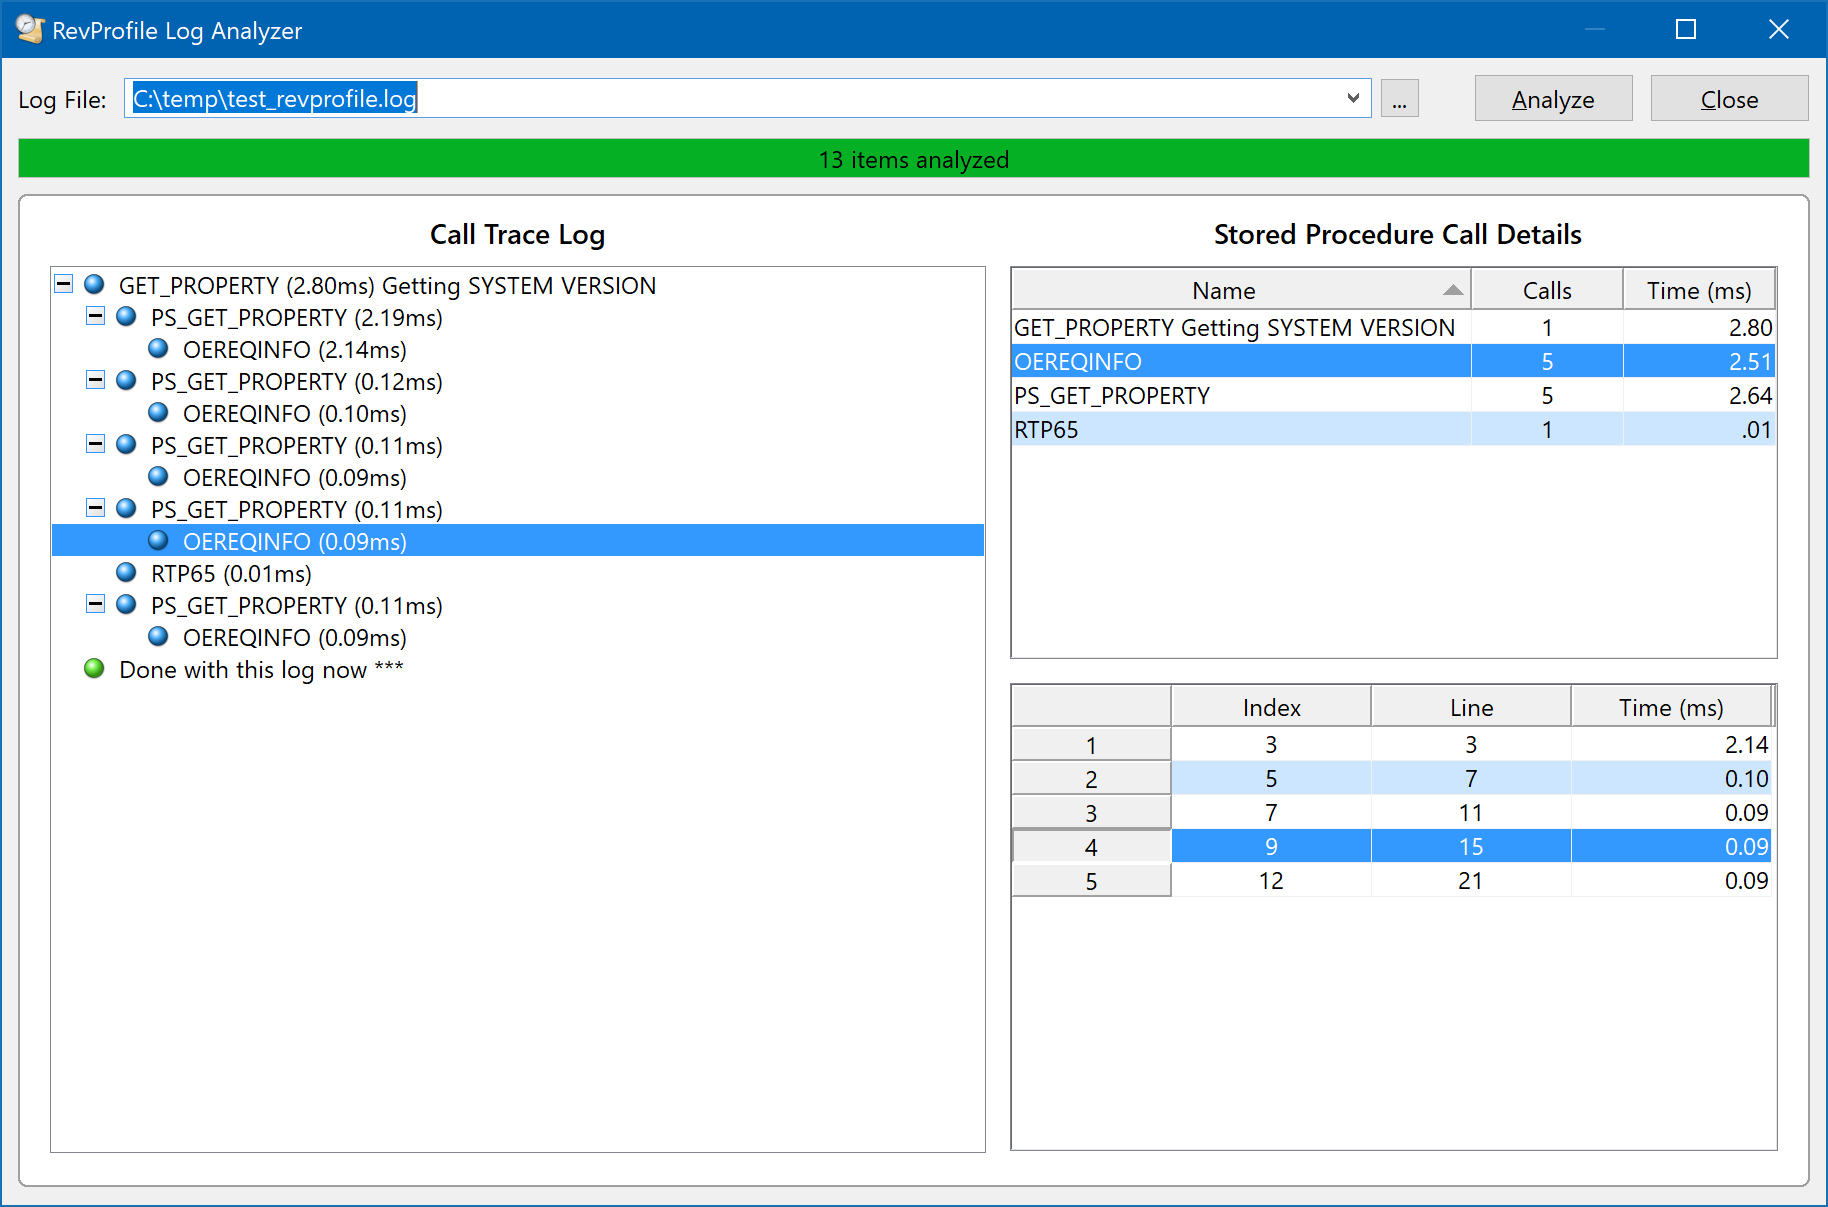
The RevProfile Log Analyzer form
This is a new form (called RTI_IDE_ANALYZE_REVPROFILELOG) that can parse a RevProfile log file and present the information in a format that is easy to use.
For example, here is the small log file example shown above processed and loaded into the form:
Using this form is fairly simple: just select the log file you want to analyze and wait for the form to parse and process the information. Once this has been done the data from the log is presented in two sections:
The Call Trace Log (on the left), and
The Stored Procedure Call Details (on the right)
The Call Trace Log
This is a TreeListBox control that shows the sequence of calls along with the time taken for that call. It mirrors the structure of the actual log file and displays text notes using a different icon (a green globe), rather than the blue one used for stored procedure calls.
Double-clicking on a stored procedure call selects it in the Stored Procedure Call Details section on the right.
The Stored Procedure Call Details
This section comprises two EditTable controls:
The top one contains a list of all the stored procedures found in the log, along with the number of times each was was executed and the total time spent executing.
The bottom one details the individual calls to the selected stored procedure – each entry in the table shows the index of the call in the Call Trace Log, the line number in the actual log file where the call was recorded, and the time taken by that call. Double-clicking a call selects the matching entry in the Call Trace Log opposite.
Things to note
Both edit tables support sorting via double-clicking on the appropriate column header.
Annotated stored procedure calls (i.e those with a note added to them via the RevProfileLog “Set Note” method) are separated from calls to the same stored procedure that are not annotated. This is to ensure that it is easy to isolate and find them in the output.
Very large log files – a cautionary note
RevProfile log files can grow rather large, especially the “static” log files that record the entire lifetime of the application. Whilst these files can be easily read and parsed in smaller chunks, representing their call trace structure in a something like a TreeListBox control can be challenging due to the time taken to load items. For example, something like a 15MB log file with nearly 200,000 calls may take several seconds to appear in the control once the log has been parsed and we set the control’s LIST property (i.e. “Loading call trace list …” appears in the progress bar), and the UI may appear frozen. This is not the case – if you are loading a very large file be sure to exercise a little patience before you reach for the Task Manager!
Conclusion
The new RevProfileLog function provides much better and much-needed profile logging functionality to OpenInsight, making the information much easier to use, and we’re sure it will help you improve the performance of your applications.
(This functionality is available in OpenInsight 10.2 from the Beta 3 release onwards)
(Edit 26 Jun 24 – Corrected name of analyzer form)
Basic+ is a dynamically-typed language, and sometimes the system will attempt to change the type of a variable before using it in an operation. For example, if we have variable containing a numeric value as a string, and we attempt to compare it to a variable containing an actual numeric value, then the former will be coerced to a numeric format before the comparison, e.g.:
   StrVar = "3"  ; // String representing an integer
   NumVar = 7    ; // Integer

   Ans = ( StrVar = NumVar ) ; // Ans is FALSE$ and StrVar
                             ; // is converted to an Integer
This works well in the vast majority of cases, but causes issues when attempting to compare strings that that could be numbers but really aren’t for the purposes of the comparison. For example, consider the following:
   Var1 = "12"    ; // String
   Var2 = "012"   ; // String

   Ans = ( VarA = VarB ) ; // Ans = TRUE$ - should be FALSE$!!
The system first attempts to coerce the operands to a numeric format, and of course it can because they both evaluate to the number 12, and are therefore treated as equal. If you wish to compare them both as strings, the usual solution has been to change them so that they cannot be converted to a number, usually by prefixing them with a letter or symbol like so:
   Var1 = "12"    ; // String
   Var2 = "012"   ; // String

   Ans = ( ( "X" : VarA ) = ( "X" : VarB ) ) ; // Ans = FALSE$
Although this works it hurts performance and can be a cumbersome solution.
OpenInsight 10.2 introduces a new set of extended comparison operators to Basic+ that ensure both operands are coerced to a string type (if needed) before being evaluated, and provides the following benefits:
Removes the need for any concatenation thereby avoiding unnecessary copying
Removes the need to check if a variable can be a number before the comparison
Makes it obvious that you are performing a “string-only” comparison so your code looks cleaner.
The new (case-sensitive) operators are:
Operator
Description
_eqs
Equals operator
_nes
Not Equals operator
_lts
Less Than operator
_les
Less Than Or Equals operator
_gts
Greater Than operator
_ges
Greater Than Or Equals operator
There is also matching set of case-insensitive operators too:
Operator
Description
_eqsc
Case-Insensitive Equals operator
_nesc
Case-Insensitive Not Equals operator
_ltsc
Case-Insensitive Less Than operator
_lesc
Case-Insensitive Less Than Or Equals operator
_gtsc
Case-Insensitive Greater Than operator
_gesc
Case-Insensitive Greater Than Or Equals operator
So we could write the previous example like so:
   Var1 = "12"    ; // String
   Var2 = "012"   ; // String

   Ans = ( VarA _eqs VarB ) ; // Ans = FALSE$
Hopefully you’ll find this a useful addition when performing string-only comparisons in your own applications.
As one observant commenter noticed in our last post there’s a new Basic+ function called “BLen” in the version 10 compiler. This is simply a synonym for the standard GetByteSize function, and was added to:
Save me some typing effort (very important)
Fit in with some of the other binary functions like BRemove and BCol2.
Of course, you may be wondering why GetByteSize/BLen is being used so much that I got tired of typing it? It’s simply that as we progress through the v10 codebase we’re updating the code to be “UTF8-safe” – i.e. we’re aiming to ensure that we don’t lose any performance when running in UTF8 mode, and a common Basic+ programming pattern for detecting a non-null variable is this:
If Len( someVar ) Then// Variable is not nullEnd
Variables in Basic+ are length-encoded, i.e. they cache the number of bytes that they occupy in memory. When running in ANSI mode the Len statement simply returns this number (because 1-byte always equals 1 character) so if it’s zero you know you don’t have any data. However, because UTF8 is a multi-byte character-encoding format, the Len statement in UTF8-mode has to scan the contents of the entire variable to count the number of characters – it can’t use the cached byte-count. This means that a simple check with Len could trigger this counting process when all you really want to know is if the variable contains data, and this could impact performance when dealing with large strings or arrays.
So, the best option is to use GetByteSize rather than Len, which always returns the cached byte-count regardless of ANSI or UTF8-mode, but as I don’t like typing very much you can now use BLen instead.
If you’re interested in writing UTF8-safe code and you’re not familiar with the Basic+ binary functions, you can find more details on them in a series of posts I wrote a few years ago on the Sprezzatura blog. You may also want to check out the Internationalization section in the OI Coding Standards document too for some more UTF8-mode hints and tips.
(Disclaimer: This article is based on preliminary information and may be subject to change in the final release version of OpenInsight 10).
In previous versions of OpenInsight the position of a Window or control has always been determined by its SIZE property – an @fm-delimited array comprised of the Left, Top, Width and Height values. This means, of course, that all of these values have to be processed together at the same time.
For example, if you only want to update a control’s Top attribute then you first have to get the current SIZE property, update the second field, and then set the entire array again like so:
This can become tedious to write and it is also inefficient.
For version 10 we’ve exposed each of the SIZE fields as separate properties so you can now access them directly. The new properties are:
LEFT
TOP
WIDTH
HEIGHT
Here’s the previous example updated to use the TOP property:
call set_Property_Only( ctrlID, "TOP", 100 )
Positioning using rectangle (RECT) coordinates
Those of you used to working with the Windows API will know that many API functions don’t use Width and Height values when dealing with positioning: they work with a “RECT” structure that uses Left, Top, Right and Bottom values to define an object’s position instead (i.e. the coordinates of the top-left corner and the bottom-right corner).
In some cases being able to update a position using Right and Bottom instead of Width and Height can actually be more efficient because it can mean less calculations needed in your own code, and so a new RECT property has been added to enable this functionality.
The new RECT property works in exactly the same way as the current SIZE property except that the Width and Height fields have been replaced by the Right and Bottom fields like so:
* // RECT property structure
* //
* //   <1> Left
* //   <2> Top
* //   <3> Right
* //   <4> Bottom
As with the SIZE property we’ve also exposed the individual fields as separate properties so there are two new properties to complement RECT which are:
RIGHT
BOTTOM
SIZE, RECT and “stealth mode”
As you may know, when using the SIZE property with the Set_Property function you can set a “visible” attribute in the 5th field that can control the visibility of the object when it is moved. For example, setting the SIZE of an invisible WINDOW makes it visible by default unless you set this visible flag to “-1”. This is still the case in version 10 and it also applies to the new RECT property as well.
However, we have also added a new 6th field that can contain a “Suppress Change Notification” flag. When this flag is set to TRUE$ the object that has been moved receives no internal notification from Windows that it has been updated, so this will stop any MOVE and SIZE events from begin raised as well as preventing any autosize processing. This is sometimes necessary when you have complex positioning requirements.
* // Full SIZE property structure when used with Set_Property
* //
* //   <1> Left
* //   <2> Top
* //   <3> Width
* //   <4> Height
* //   <5> Visibility
* //   <6> Suppress Change Notification
* // Full RECT property structure when used with Set_Property
* //
* //   <1> Left
* //   <2> Top
* //   <3> Right
* //   <4> Bottom
* //   <5> Visibility
* //   <6> Suppress Change Notification
(Disclaimer: This article is based on preliminary information and may be subject to change in the final release version of OpenInsight 10).
If you’ve ever had to work with the STYLE or STYLE_EX properties in OpenInsight you’ve probably had to write some gnarly code like this to get around the strange way it returns a string containing a C-style hex representation such as “0x8234ABDB”:
We’ll probably never know the reason the original authors of OpenInsight decided to implement the property like this, but with version 10 we’ve provided a pair of new properties called “STYLE_N” and “STYLE_EX_N” that return the numeric (decimal) representation of a control’s style directly thereby saving the need for the extra parsing.
One of the problems with the existing Set_Property function is that it also performs an implicit Get_Property operation to return the previous contents of the property to the caller. In many cases this information is simply discarded after the “Set” making the “Get” call actually unnecessary, and this inefficiency goes unnoticed as the quantity of information retrieved during the “Get” is small. However, in some cases the effect is noticeable: For example, setting the ARRAY property of an EditTable that contains several thousand rows to null (i.e. clearing it), will produce a noticeable delay while the ARRAY contents are accessed and returned.
A new subroutine, called Set_Property_Only, has been added to the OpenInsight 10. This operates in the same way as the existing Set_Property function except for the fact that it doesn’t bother performing a Get_Property operation to return the previous property contents to the caller. This helps you to optimize your code for better performance.